Expand Data Access with Turnkey Interfaces in Piano Analytics
Gone are the days when data was in the hands of an exclusive group of analysts who alone had the skills to export and interpret that data for teams across the business. Piano Analytics makes data accessible, shareable and exploitable for everyone in an organization.
Built from the ground up to be user-friendly and accessible, Piano Analytics is designed to allow business users to analyze and manipulate their data, then quickly and easily share reports with other stakeholders.
Four interfaces, varying in complexity, allow all Piano Analytics users to access the decision-ready insight they need at the right time:
Explorer: Easy access for data novices
Explorer provides built-in reports and interfaces for fast and easy access to teams, no matter their data proficiency level. Turnkey analysis is built into the software and is the ideal starting point for exploratory analytics work. Want to enable teams to access total visits, page view visits, bounce rate, time spent visits and page views? Look no further—they’re automatically populated within Explorer.
The insight in Explorer also goes beyond displaying basic information, like how many visits were made to a site page: It allows you to go deeper by viewing how many times a specific, business-oriented event has been triggered on that page, like how many registrations or subscriptions have been generated by a particular article or news category. Piano Analytics then provides pre-built, ready-to-use reports that users can customize to their needs so all reporting is perfectly aligned with the expectations and needs of each individual.
Use Explorer to dive into more specific analyses and manipulate your data. Gain insight into marketing attribution and campaigns performance. Or zoom in on user journeys to see how visitors are navigating through your website. You can then save your ready-made analysis, personalize it and share it with other teams.
Dashboards: Built-in visualization, customizable to your needs
The Dashboards interface allows you to create custom views and run custom reports, rapidly sharing information through easy-to-understand visualizations. Designed to meet the full range of business analytics requirements, our built-in visualizations can be fully customized to display the numbers that matter to your stakeholders. It then allows you to share the information quickly and seamlessly with your colleagues.
Personalized Dashboards and other visuals can also be displayed live on screens, refreshing every five minutes for at-a-glance access to information on your latest site updates and content performance. Dashboards and reports can also be delivered via email at regular, predefined intervals: daily, weekly or any other time you choose.
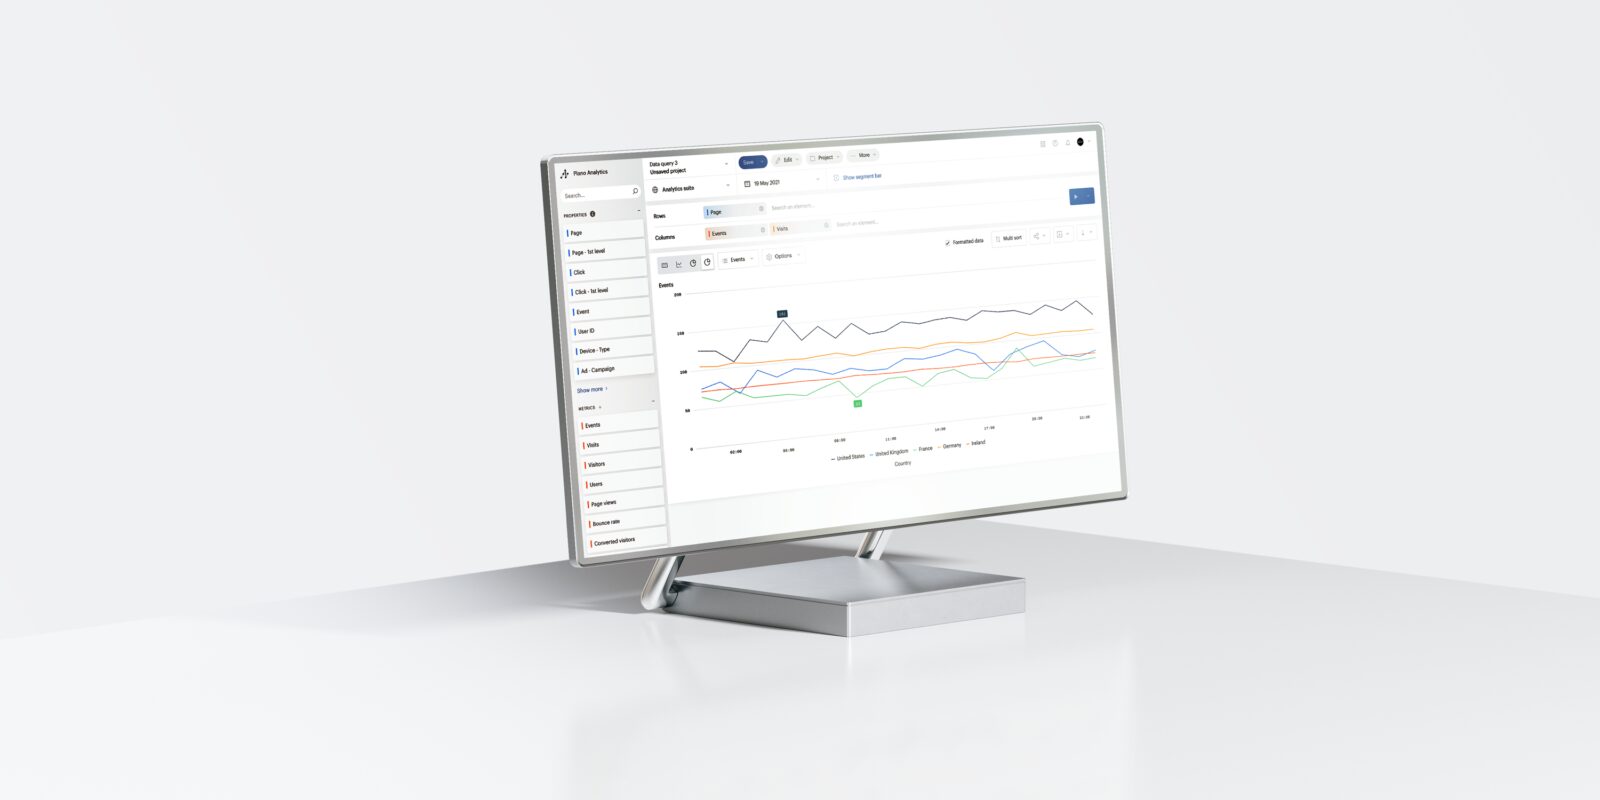
Data Query: Advanced analysis for data pros
Data Query is the most advanced code-less querying interface, designed to let you deep-dive into your most granular analytics data and extract it in real time. While other interfaces are made to be accessible for even data novices, Data Query provides the tools and functionality required for advanced querying and analysis by data scientists. This interface also includes pre-constructed analysis with features like segmentation and cross-combination of properties.
Because Data Query is connected directly to Dashboards and Explorer, it allows Piano Analytics users to make data more actionable. Starting with Explorer, you can push analyses into Data Query for advanced data mining—and create advanced datasets or send data to Dashboards to facilitate sharing and publication.
For predictive analytics and anomaly detection, the Axon contribution model in Piano Analytics uses cutting-edge machine learning to detect and understand any irregularities in your traffic. Any user can then create Watcher alerts, which send an email to a specific person when there’s an anomaly on the site, such as a sudden rise or drop in traffic. This allows team members to keep constant tabs on your site to address any unexpected issues that arise.
Web Browser Extension: Instant on-page metrics
Our In-Page Piano Analytics extension gives you instant analytics in real time on your desktop in an easy-view miniature window. It’s the perfect tool for content marketers and demand generation teams to quickly access the analytics they need most, like the performance of a specific piece of content in terms of visitors, pageviews, downloads and more.
Everyone's an analyst with Piano Analytics
Increasing data literacy in your organization starts by ensuring everyone can access and use the analytics tools they have at their disposal. Piano Analytics helps you remove the technical obstacles to analysis and provide access to every employee.
Built-in reports and user-friendly interfaces offer easy data access to make your teams smarter—and allow data experts and IT professionals to focus on in-depth analysis.
Request a demo to learn more about making the shift to a data-driven business culture by democratizing your analytics.